Introduction
How governments make decisions
Although many readers chose this book for an introduction to R, geospatial data science, and machine learning, my goal was to write a book about public-sector decision-making.
The typical methods-driven public policy book is about generating evidence that legislators can use to set budgets. This ‘budgetary’ decision-making receives the bulk of attention from academics, journalists, and policymakers - and for good reason. However, simply signing a promising bill into a law, does not guarantee success.
Once millions of dollars are budgeted for a program, a government agency decides how to allocate that money, to whom, how often, and for how long. Despite receiving far less attention than budgetary decision-making, this ‘operational’ decision-making is equally important. A good policy manifested as a poorly designed program can be just as ineffective as a bad policy.
A program should maximize benefits and minimize costs. This is much more difficult in the public sector, than in the private sector. There are no shortage of CEOs and management professionals who bloviate ad nauseam on the need for government to embody private sector ideals and leadership practices.
Optimizing the cost/benefit ratio is easier in business because the only relevant bottom line is profit. It matters little whether profit maximization has a negative effect on competitors, consumers, the environment, or other stakeholders. Optimizing the cost/benefit ratio in government is far more difficult because the bottom lines are many, and at times, ambiguous. Yes, there are economic bottom lines, but a ‘good’ decision in government must simultaneously optimize for economics, political cohesion, equity, and bureaucracy, to name a few.
Because the bottom lines in government are so nuanced, it is often very difficult to understand how decisions are made. In my experience, there are four typical approaches:
Ad hoc: ‘Why do we do it this way?’
‘I don’t know.’
Decision-making without precedent is rare but not unheard of. Ad hoc decision-making is most common when decisions are made by individuals who are free to act autonomously in the absence of a top-down, centralized decision-making apparatus. An example might be an inspector, guided by a loose set of top-down directives on what to inspect and when. While an experienced inspector may make more good decisions than bad ones, the decisions of an inexperienced inspector may have significant economic and social costs.
Political: ‘Why do we do it this way?’
‘Because I can’t afford to upset the elected official who sets my agency’s budget every year.’
Government is political by nature, and thus decisions may serve certain groups over others. If say, property developers capture a disproportional amount of political capital, then there is a higher likelihood that government decisions will go in their favor. The result is decision-making incentives that may not optimize for critical bottom lines, like equity.
Institutional knowledge: ‘Why do we do it this way?’
‘Well, because we have always done it that way.’
As government progressed from Tammany-style, political machine governance to a system of checks and balances in the mid-19th century, a set of incentives emerged designed to maximize efficiency, promote rational decision-making, and prevent corruption. The ‘bureaucracy’ that resulted is characterized by top-down organization, a clear division of labor, practical expertise, and a rigid set of rules. While the bureaucracy can be helpful, it may also disincentivize innovation.
For example, government data scientists often report difficulty in downloading open-source technology because IT managers argue it preempts their ability to prevent computer security mishaps. Thus, older, clunky, and expensive to maintain ‘legacy computer systems’ are often hard to pivot away from.
Similar dynamics may exist when individuals attempt to innovate from midway in the chain of command. Innovation is newness and nothing in government is newer than an incoming administration - with new ideas, new processes, and new politics. Members of the old administration who are unable to work within the new paradigm are often dismissed. Given the potential for shifting political winds every four years, self-preservation may lead the career bureaucrat to avoid risk-taking. When all stakeholders (particularly senior leadership) stay in their own lane, organizational processes become entrenched and innovation stifled. Not only then does, ‘Because we have always done it that way’, become a slogan, but it becomes a firewall.
Evidenced-based: ‘Why do it we do it this way?’
‘Because the data suggests this is the best approach.’
Evidenced-based public policy is a major theme of this book. One of the key indicators of an evidenced-based approach is whether operational decisions are made reactively or proactively. Cash-strapped agencies may not have the resources to be proactive, instead they work to put out fires in real time. The proactive decision-maker generalizes their knowledge and experience from the past to preempt fires before they start.
Civil servants are the best among us - vastly underpaid, they work hard to solve society’s most complex problems. While most government agencies use data and evidence in one form or another, the analytics discussed in this book are expressly designed to enable proactive decision-making, and hopefully, more effective government programs.
When I discuss this work with policymakers, the initial focus is almost never on data science or technology. Instead, I try to learn how they currently make decisions. What are the inputs, outputs and consequences of those decisions? A more evidenced-based approach is only possible with answers to these questions. Thus, the foundation for successful public-sector data science is not statistics or computer science, but domain expertise.
Context as the foundation
Each chapter of this book focuses on a ‘use case’. For our purpose, a use case is a specific set of circumstances that drive the development of a technology solution. For example, the use case of the Uber app is to match a rider with a driver and get them both from point A to B. The use case of Zillow’s Zestimate algorithm is to provide a home buyer with an estimate of home value even if that house has not sold recently.
The term ‘use case’ is more prevalent in technology than in social science. An anti-eviction effort for instance, is far more comprehensive than Uber’s singular use case: A housing stability initiative seeks to decrease evictions by providing tenants with legal protections; enacting more onerous landlord regulations; strengthening code enforcement; promoting affordable housing in neighborhoods of opportunity; bettering schools; creating safer streets; more intergenerational mobility and so on and so forth.
A comprehensive effort like this, can however, be deconstructed into a series of individual programs and further still, into a set of discrete use cases around service delivery and operational decision-making. Perhaps one use case uses housing and court data to predict landlords who are renting without a license. Another might be to develop a website that allows at-risk families to be linked with community legal services.
How can complex policy initiatives boil down to discrete technology use cases? Start with the context. Here is my framework for doing so:
What is the policy? In a nutshell, the policy is a set of guiding principles used to achieve a set of goals or outcomes. If the data scientist does not know the policy, then it will be difficult to design solutions to achieve policy goals. Interestingly, sometimes different policies can support the same policy goal, and often policies change dramatically with successive administrations, across geographic locales, and over time.
What are the programs in place to achieve the policy goals? Programs and policies are often confused as being the same. The program is the tool used to implement the policy to achieve the policy goals. Designing strong programs is incredibly difficult and failed programs may result from ill-conceived policies or from bad program design. Perhaps the designer did not consider unintended consequences or misunderstood the role of incentives. In my experience, good programs have strong cost/benefit ratios, meaning a marginal government investment generates a significant economic, social, public health, etc. return for citizens.
Does a program work? Some government programs are truly transformational and others, not so much. Program evaluation is the art and science of estimating the efficacy of a program for the purposes of budgetary decision-making. It is typically the domain of trained social scientists who understand programs so well that they can estimate the causal impact of the program on an outcome of interest.
How is the program delivered? This is operational decision-making, and the area where data scientists can have the greatest impact. The goal is to deliver resources when, where, and to whom they are most needed. Who is eligible for a program? Must participants actively sign up for the program or can they be targeted based on certain criteria? Can we learn from the experience of past program participants to intervene more effectively with future participants? Do citizens interact with the program by mail, by showing up in person, or through a web portal? How can data and technology help an agency improve the program at the margins? These are just a few of many important questions.
This context is required for data scientists to have impact in government. While it is possible to procure data science from private vendors, the need to scale across many customers means one solution often lacks local domain experience. These products have also been known to ‘over promise and under-deliver’ - especially when their sales pitches include terms like “Smart Cities” and “AI”.
Developing data science in house is much harder but ensures that solutions are based on local knowledge. The best mechanism for growing this human capital is free and open source technology. Open source software and open data has been a great catalyst for public-sector innovation, but the next horizon is ‘open analytics’. As governments collect similar data and have similar use cases, shared analytical tools will help data science learning scale more easily.
I hope this book helps jump start the open analytics movement and helps position data science as a tool for operational decision-making. While many see data science as this shiny new object - I contend that it is really just a new take on Planning - something government does by default. Data science as a Planning tool is where its real potential lies.
Data science as a planning tool
I relate data science to Planning in the context of strategic planning rather than traditional, ‘comprehensive’ plan-making. Both Planning and data science are interested in the effective allocation of limited resources. Both ask what resources are at hand? Which are lacking? And where can these resources go to mitigate risk and promote opportunity?1
As I mentioned, a good government program means a greater return on a marginal investment. Data science as a Planning tool, is an example of a marginal government investment, particularly as government already collects data and already has a mandate to plan, mitigate risk, etc.
Many chapters in this book are focused on predictive modeling via a set of methods referred to as machine learning. The goal of machine learning as I see it, is to ‘borrow the experience’ of people or places from the recent past and test the extent to which that experience generalizes into the near future.
In this context, prediction is a powerful Planning tool that can borrow from the overdose experience on these vacant lots to predict overdose risk on those vacant lots; and can borrow the homelessness experience from these residents to predict homelessness risk for others.
When these risks are known, planners can more effectively target their limited resources, like overdose prevention and housing programs.
It is hard to predict things, particularly in complex urban systems. As we will learn in Chapter 3, the goal is not to model all the complexity, but slice off use cases in more bounded systems with more simplistic interactions.
The algorithms in this book are judged by their ‘usefulness’ as Planning and decision-making tools. A useful tool has a greater cost/benefit than the ‘business-as-usual’ approach. While economic costs and benefits are important, social costs are far more critical. Much time is spent in the second half of the book ‘opening the black box’ of our algorithms to mitigate decisions that further disenfranchise or discriminate.
By the Conclusion, we will learn how these insights inform a new ‘Algorithmic Governance’ approach, built on the belief that algorithmic decision-making is just a new take on the traditional approach to program design and Planning.
Many Planning questions are placed-based, and start with the word “where”. This book focuses heavily on ‘Geospatial data science’ - which is a new label for a discipline, quantitative geography, that goes back at least as far as the 1950s. Quantitative geography has a rich history, much of which relates directly to Planning.
Geospatial data science repurposes the tools of quantitative geography to support Planning that increasingly relies on large, real-time geospatial databases, predictive modeling, data visualization, analytical dashboards and other emerging technologies.
Answering “where” questions can inform placed-based decision-making - but doing so requires an understanding of how spatial data is different from non-spatial data, and how modeling spatial systems requires a unique understanding of why things locate where they do.
The importance of spatial thinking
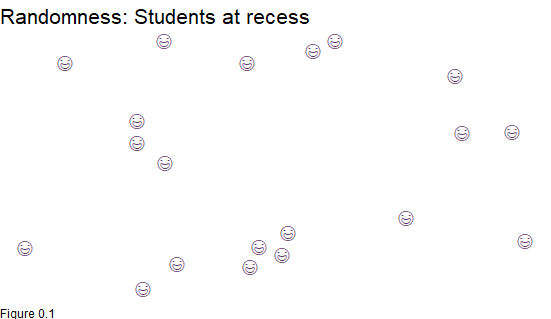
Very infrequently are social science phenomena randomly distributed in space, like the above visualization of students roaming the recess blacktop.
Developers do not locate their next suburban shopping mall by throwing a dart at the map. Police do not randomly allocate patrols to neighborhoods. Civil engineers do not connect any two places with a highway. Social scientists have spent decades understanding why people, businesses, and other entities locate where they do. Understanding why firms cluster can help cities grow the next Silicon Valley. Understanding why gentrifiers buy into certain neighborhoods can help cities plan affordable housing.
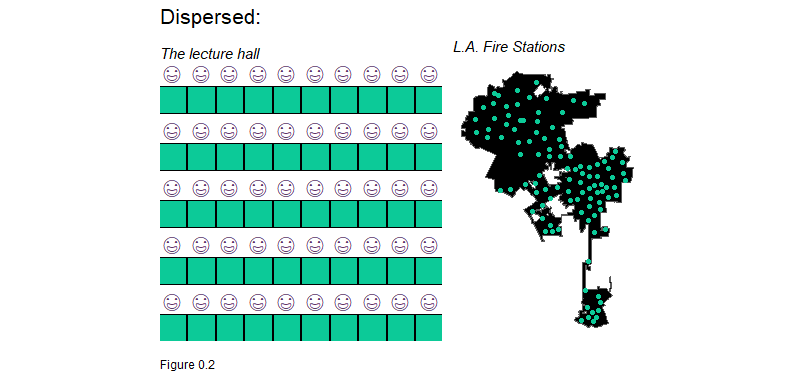
The best way to start understanding these dynamics is to simply map the ‘spatial process’ or spatial pattern in the outcome of interest. Let us look at some real and metaphorical examples of spatial processes below. Figure 1.2 illustrates the spatial configuration of students in a lecture hall. Why are the students located at a uniform distance from one another?
This spatial process is called ‘dispersion’. A decision was made by the room’s designer that no more than 60 students can be in the room and all chairs will be located at a fixed distance. As illustrated below, the location of fire stations provides a real-world example of dispersion. Fire stations are distributed to efficiently minimize response times and to ensure that fire service areas do not overlap.
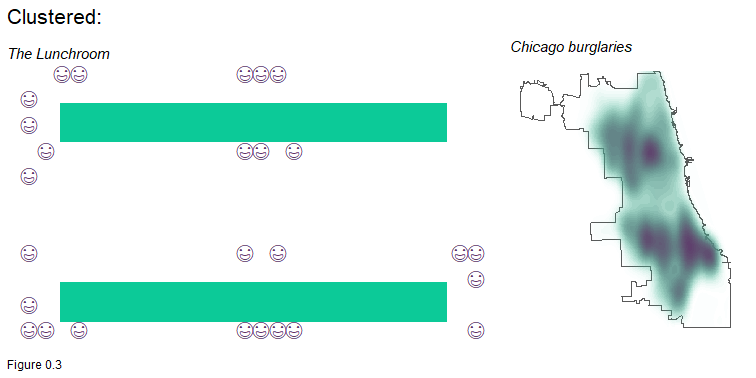
A third spatial process is clustering. The students below have chosen to sit with their friends at long tables in a lunchroom. This configuration is the result of students self-selecting into lunchtime cliques. Reported burglaries are a real world example of clustering - a spatial process discussed at length in Chapter 5.
Most spatial processes of interest to policymakers exhibit clustering. Tech companies cluster to take advantage of labor market efficiencies. Gentrifiers cluster to capitalize on emerging amenities. Disease clusters because vulnerable populations live among one another.
The lecture hall designer chose to disperse students, while in the lunchroom, students self-selected into clusters. One way to think about these spatial processes is that the former is driven by an external decision imposed on the system, while the latter involves decisions imposed on the system from within.
The most difficult spatial phenomena typically feature both forms of decision-making. Take segregation for example. Segregation results from the external decisions of institutions to force certain people to live in certain places. It may also occur because members of one race self-select into neighborhoods with others of their same race. A thorough understanding of both spatial dynamics is required to fully understand segregation.
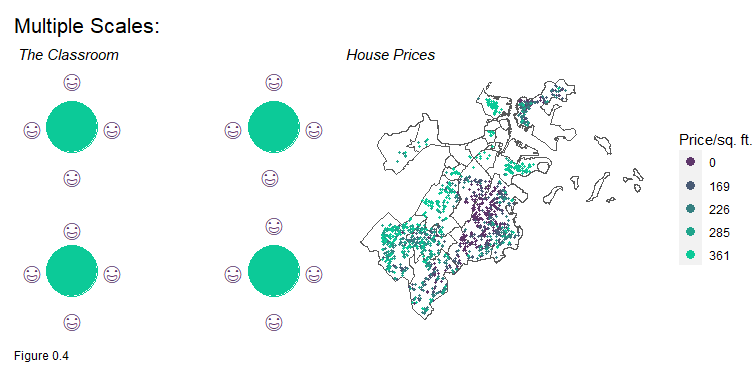
The below classroom is an example of multiple spatial processes. At a more global scale, an external decision was made to disperse the tables and thus the students at equal intervals. The students then can self-select into table clusters of their choosing.
Many spatial phenomena involve multiple scales of spatial interaction. The Boston home price map illustrates how home prices cluster across neighborhoods but also vary within neighborhoods. Chapters 3 and 4 explore the spatial process in home prices to help predict prices across space.
In a word, it is scale that makes the understanding of spatial process so difficult, and scale is the most difficult challenge to overcome in spatial analysis. Scale problems persist in how arbitrary units like Census Tracts are used to summarize an underlying population; in how one measures exposure from a community to nearby risk factors; and most importantly, in how a certain dynamic in one community generalizes to community contexts elsewhere.
These different spatial processes of clustering, randomness, and dispersion are well known to geographers. The famous First Law of Geography states that, although all things are related, nearer things are more related than farther things.2 More of a statistical inevitability than a law, this ‘spatial autocorrelation’ suggests, for instance, that the elevation five feet from you is more like the elevation under your feet, than the elevation 5 miles away. The same can be said for crime, home prices, and the income of your neighbors. The more the analyst understands the scale in which nearer things are related, the more useful their analytics are for decision-making.
Learning objectives
This book is as concerned with data science context as it is with data science code. I hope it appeals both to budding public sector data scientists as well as policymakers looking to learn more about this technology. If you are reading the print version of this book and would like to run the code, the online ‘Bookdown’ makes it easy to copy and paste code from your browser into R.
Material for this book was originally written for graduate students in the Master of Urban Spatial Analytics program at the University of Pennsylvania - a program I direct. Most of my students come in with at least some technical experience - mostly in spatial analysis, but many have no experience writing R code. My goal is not to teach them coding per se, but how to take the code I give them (and have given you) and hack it together to create something new. I have found this format works well for teaching data science to social science students, so long as readers are interested in solving the underlying problems that motivate each chapter.
This book is written in R which is a free and open source programming language with millions of users worldwide. R has fostered a huge community of impassioned individuals who are equally as interested in developing code for their own uses as they are in sharing it with others. As a result, a free and open source R package exists for almost any analytical pursuit. The reason to code data science rather than mouse click it, is reproducibility - to write the code once such that it can be replicated in the future with ease.
Because R is open source and community-driven, it is constantly being updated and improved. Inevitably, the code in this book will become dated (likely as soon as it is published), and while I will try to update the text over time, you may have to rely on the internet for quick fixes.
There are many books and resources that you can use to supplement your learning. Google is smart enough to understand R-related error questions and will likely pass you along to websites like Stackoverflow. There are two supplemental books that I can recommend as well. The first is R for Data Science by Hadley Wickham and Garrett Grolemund which provides a thorough introduction to the tidyverse approach to R programming.3 The second is Geocomputation with R by Lovelace, Nowosad & Muenchow.4
Chapters 1 and 2 of this book focus on descriptive data science. Chapter 1 introduces R in the context of exploratory spatial analysis, developing a series of transit indicators to communicate complex metrics to non-technical decision-makers. Chapter 2 continues introducing the R workflow as well as geoprocessing to help planners in Lancaster County, Pennsylvania choose a town suitable for new development rights.
Chapters 3-8 convey predictive data science. Chapters 3 and 4 introduce geospatial machine learning, providing a framework for assessing the accuracy and generalizability of models across different spatial contexts. The goal is to forecast home prices, an algorithm many counties now use to assess property taxes. Home prices exhibit a very nuanced spatial process which makes it a fascinating first use case of geospatial machine learning.
Chapter 5 introduces geospatial risk prediction, demonstrating the perils of Predictive Policing. Data from Chicago is used to train a predictive model that predicts burglary risk for every location citywide. Predictions are evaluated for fairness and we begin to discuss how selection bias is converted to algorithmic bias.
Chapter 6 introduces person-based predictive models focusing on ‘churn’, the probability that a client will re-subscribe to a subsidy or service. This use case is incredibly important for agencies that allocate resources to individuals, households or families.
Chapter 7 builds on chapters 5 and 6 by providing a framework for assessing algorithmic fairness in person-level predictions. Using a classic example from the criminal justice field, the goal is to understand the extent to which a decision-making tool may have a disparate impact on a protected class, like race.
Chapter 8 aggregates much of what we have learned about geospatial machine learning to help forecast space/time rideshare demand in Chicago. This use case brings us right to the cusp of integrating ‘Big Data’ in forecasting models, which is the reasonable next step for the would-be public-sector data scientist.
Finally, the Conclusion connects the algorithmic themes of the book with traditional Planning practice, introducing the ‘Algorithmic Governance’ framework for integrating data science into government programs.
All of the data in the book are open data, much of which can be accessed directly from the web. In each chapter, code is provided for downloading these datasets from the web. Should the form or path of these datasets change, the code will no longer be useful, and readers should read in data from the book’s Github repository.5
Assignments are associated with each chapter. The goal is to have readers replicate what they have learned on a new dataset and to communicate important themes and findings to non-technical decision-makers. If you are working on these assignments independently, I urge you to focus on data visualization and short, concise written narrative.
Planners might recognize this as the SWOT (Strengths, Weaknesses, Opportunities & Threats) model of strategic planning↩︎
Tobler, W. R. (1970). A computer movie simulating urban growth in the Detroit region. Economic geography, 46(sup1), 234-240.↩︎
https://github.com/urbanSpatial/Public-Policy-Analytics-Landing↩︎